
FIGURE 1. Interdependent phosphorylation of c-Myc at Thr-58 and Ser-62 control stability in yeast.
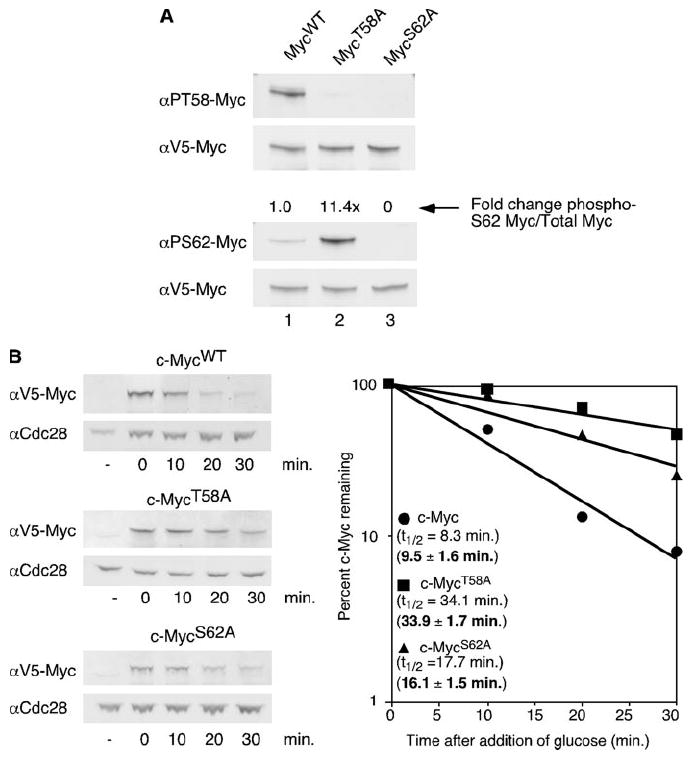
A, V5-tagged MycWT, MycT58A, or MycS62A expression was induced from a GAL1 promoter in the BY4741 yeast strain by the addition of galactose for 1 h at 30 °C. Equal cell numbers were visualized by Western blot analysis with αV5, α-Ser(P)-62 (αPS62), or α-Thr(P)-58 (αPT58) using dual probing and overlay with the Odyssey Imaging System. Protein levels were quantitated, and ratios of phosphorylated c-Myc to total c-Myc were calculated as described under “Materials and Methods”. -Fold change compared with c-MycWT is shown. B, V5-tagged MycWT, MycT58A, or MycS62A expression was induced for 1 h in the BY4741 yeast strain at 30 °C by the addition of galactose. Glucose was added to inhibit expression of c-Myc. Cells were harvested at the time points indicated after glucose addition and lysed in SDS sample buffer. Equal cell numbers were visualized by Western blot analysis with αV5 and αCdc28. c-Myc protein levels and Cdc28p levels were quantitated by the Odyssey Imaging System, and c-Myc levels were normalized to total protein as determined by the amount of Cdc28 protein. c-Myc levels at each time point are shown as a percent of the first time point and are plotted on a semi-log graph. Best-fit lines were calculated using Microsoft Excel. Experiments were repeated three or more times, and representative data are shown. Mean half-lives ± S.D. are indicated in bold.