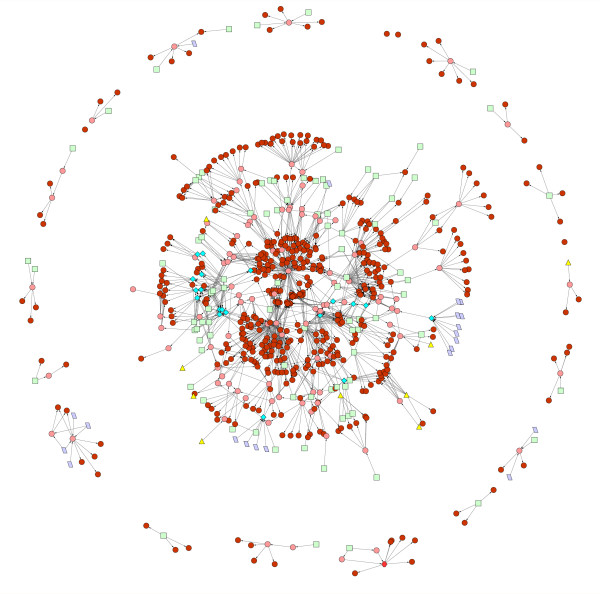
Figure 1.
Map of the transcriptional regulatory network controlling metabolism in E. coli. In this figure, there are genes coding for the TFs (pink circles), genes coding for enzymes (brown circles), external metabolites (green squares), certain internal fluxes (purple parallelograms), stimuli (yellow triangles) and other conditions (blue diamonds). See text for details.

