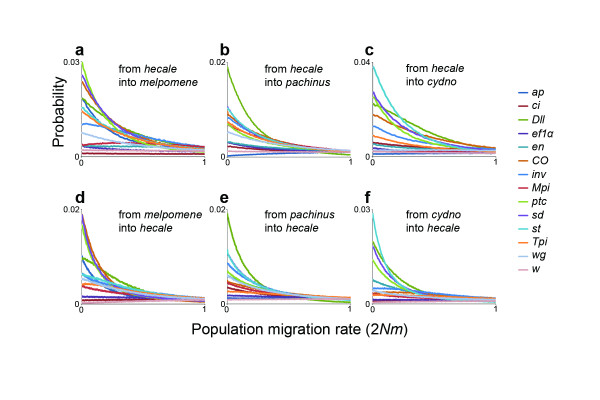
Figure 3.
Marginal posterior probability distributions for locus-specific migration rates. Probability distributions for gene flow from H. hecale into H. melpomene, H. pachinus, and H. cydno, respectively (a, b, c). Probability distributions for gene flow into H. hecale from H. melpomene, H. pachinus, and H. cydno, respectively (d, e, f). Despite substantial variation in distribution shapes, most peak at or near zero suggestive of little or no gene flow.

