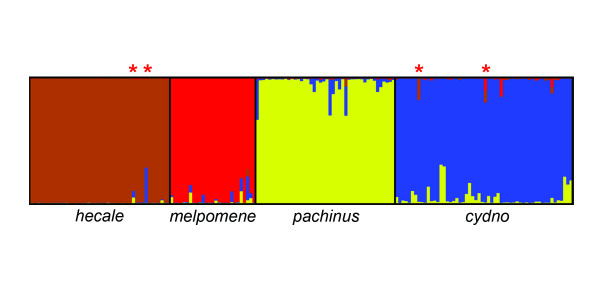
Figure 5.
Genetic clustering based on 520 AFLP loci. Each individual is represented by a narrow vertical column with the proportion of the four colors indicating the genome proportion derived from each of the four populations. Two H. hecale and two H. cydno individuals exhibited evidence of mixed ancestry with the opposite clade (asterisks).

