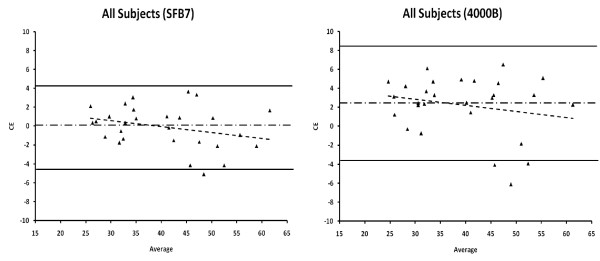
Figure 1.
Bland and Altman plots of all 28 subjects comparing total body water (TBW) estimations by the SFB7 (Imp™ SFB7) and 4000B (XiTRON 4000B) to deuterium oxide (D2O). CE = constant error [CE = TBW D2O - TBW BIS (SFB7, 4000B)]; Average = [TBW D2O + TBW BIS (SFB7, 4000B)]/2. The solid lines represent the upper and lower limits of agreement (± 1.96 SD). The dotted/dashed line represents the constant error or mean bias. The dashed regression line represents the trend between the differences of methods and the mean of both methods.

