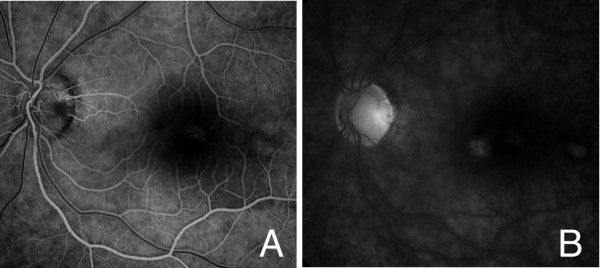
Figure 2.
Fluorescein angiograms of the left eye. (A) Fluorescein angiogram in the early phase showing hypofluorescence at the optic pit and many hyperfluorescence spots can be seen in the macular lesion.(B) The hypofluorescence at the optic pit and glial tissue turned to hyperfluorescence with weak dye leakage in the late phase.

