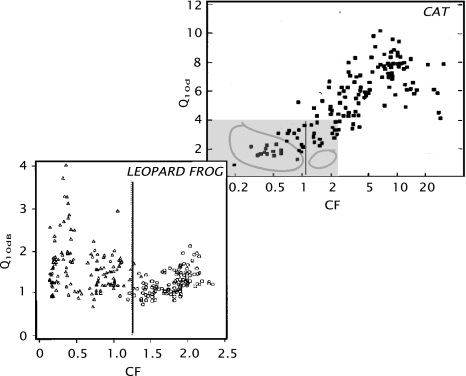
Fig. 5.
Comparison of the filter quality factor  versus the characteristic frequency (CF, in kHz) of nerve fibers from the cat cochlea (adapted from Evans 1975) and the leopard frog (adapted from Ronken 1991). In the leopard frog graph, the triangular symbols correspond to nerve fibers from the amphibian papilla; the circles to fibers from the basilar papilla. The black line indicates the upper limit of the amphibian papilla’s frequency domain. The grey area in the upper (cat) graph corresponds to the area of the lower (frog) graph. The loops indicate the approximate perimeter of the fiber populations in the lower graph for the amphibian papilla and the basilar papilla.

