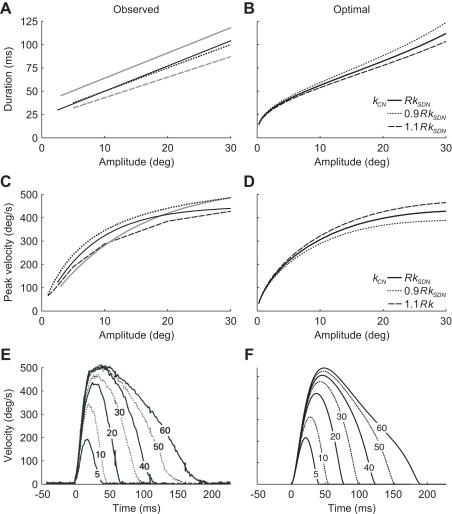
Figure 1. Observed and optimal main sequence.
A. Observed duration as a function of amplitude for horizontal saccades starting from the primary position or moving symmetrically about it. Different lines denote linear fits reported by different sources: -––[2], -––[3], —[4], -––[5], ……[6]. Lines are plotted for the range of amplitudes for which the fit was made. B. Optimal duration as a function of amplitude for horizontal saccades moving symmetrically about the primary position for three different levels of CN (kCN = RkSDN is the best estimate of the actual level [12]). C. Observed peak velocity as a function of amplitude for similar horizontal saccades as shown in A. Different lines denote fits or linearly connected data points reported by different sources (see legend of A for the sources). D. Peak velocity of optimal saccades as a function of amplitude for horizontal saccades moving symmetrically about the primary position for three different levels of CN. E. Observed velocity profiles of horizontal saccades moving symmetrically about the primary position for amplitudes of 5, 10, 20, 30, 40, 50 and 60 deg (Reprinted from [4] with permission from Wiley-Blackwell). F. Velocity profiles of the optimal saccades (with their optimal duration) shown in E.

