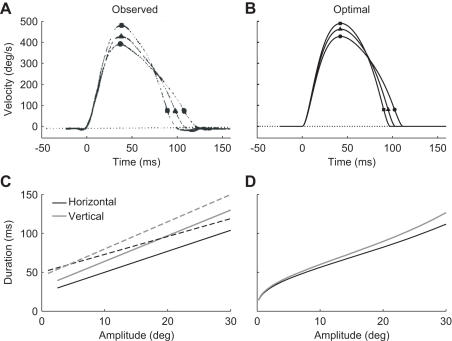
Figure 3. Effect of movement direction on saccade velocity and duration.
A. Observed velocity profiles of three 30 deg rightward saccades, starting at –▪– 20, –▴–10 and –•– 0 deg to the left of the primary position (Reprinted from [28] with permission from Elsevier). B. Velocity profiles of the optimal saccades for the situation shown in A. C. Linear fits of observed duration as a function of amplitude for horizontal and vertical saccades. The solid lines are from [4] and [29], and the dashed lines are from [30]. D. Optimal duration as a function of amplitude for horizontal and vertical saccades moving symmetrically about the primary position.

