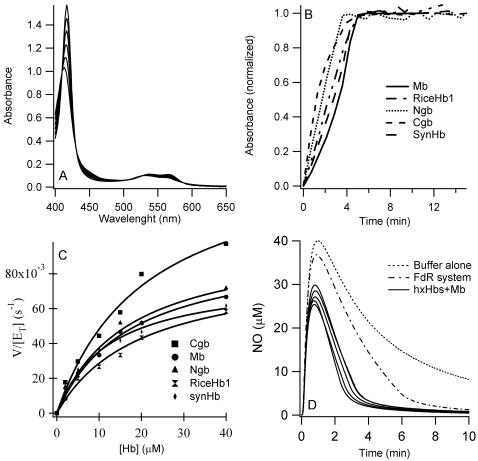
Figure 5. Enzymatic reduction by ferredoxin-NADP reductase and catalytic NO consumption.
. A. Absorption spectra associated with the reduction of Ngb (10 µM) by 1 µM ferredoxin-NADP reductase in the presence of CO (1 mM). B. Change in absorbance at the Soret peak (CO-bound) associated with the reduction is plotted vs time for each Hb (10 µM). The data are normalized to the absorbance change expected for complete reduction of the Hb in question. C. Enzymatic reduction of Mb and hxHbs by ferredoxin-NADP reductase. V/[ET] calculated at different Hb concentration is plotted vs [Hb]. The fit to the Michaelis-Menten equation gives Km and Vmax for reduction of each protein. D. Consumption of 40 µM NO by 10 µM oxyHb as measured by an NO electrode, in the presence of ferredoxin-NADP reductase (1 µM). For each protein, after addition of NO, the signal drops by ∼10 µM corresponding to stoichiometric NOD. [NO] then decreases linearly indicating catalytic NO destruction. Rates of consumption were calculated from the linear phase of catalytic NO removal.

