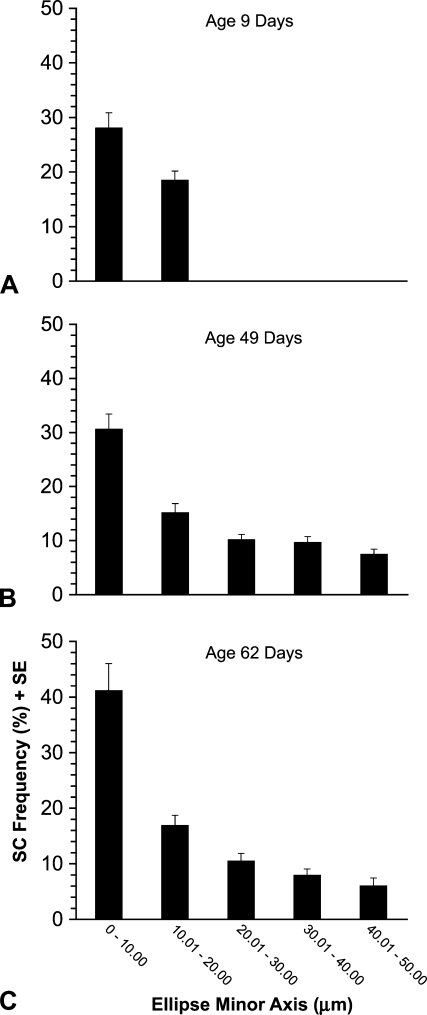
Figure 5.
SC frequency according to fiber profile size. Three birds were studied at each of three different ages: (A) 9 days, (B) 49 days, and (C) 62 days. Between 200 and 250 fiber profiles from each pectoralis studied were arranged into different groups according to their ellipse minor axes values. Each column represents mean SC frequency (%) ± SE. The frequency of SCs in ages 49 and 62 days is significantly (p<0.01) reduced with increasing fiber size. The smaller fiber profiles are the tapered ends of larger profiles (Rosser et al. 2000).

