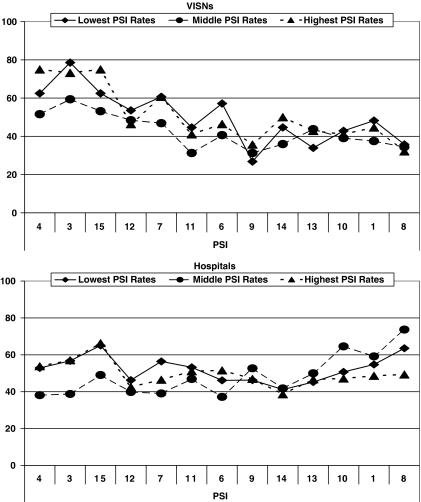
Figure 3.
Average Percentages of VISNs, or Hospitals, That Were, among the Lowest, Middle, or Highest Third of Smoothed Patient Safety Indicator (PSI) Rates in 2001, and Also Were in the Same Third in Other Years. Percentages in the Same Third in Each of the Other 8 Years Were Averaged. PSIs Are Listed in Order of Frequency.

