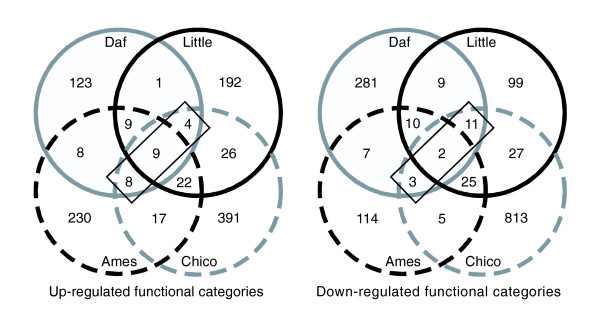
Figure 1.
Overlap of differentially expressed functional categories in long-lived nematodes, fruitflies and mice. These Venn diagrams show the number and overlap of significantly differentially regulated functional categories (p < 0.05; GO categories and Interpro domain families) identified in each dataset using Catmap. While most of the differentially expressed categories in each dataset are species-specific, a small number of categories (boxed) show significant changes in expression in response to reduced IIS in all three species. These categories are detailed in Table 5.

