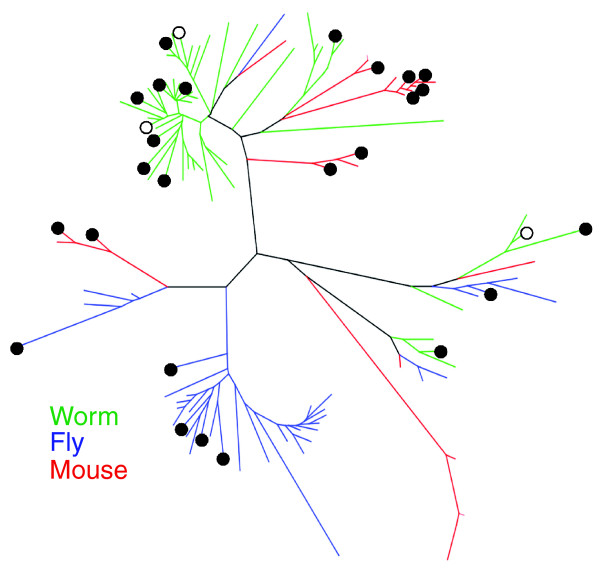
Figure 4.
Phylogenetic tree of the GST gene families from worms, flies, and mice. Genes from each species are color-coded, and significantly (q < 0.1) differentially expressed genes in each dataset are shown by closed (up-regulated) or open (down-regulated) circles (see Additional data file 2 for phylogenetic trees for GST, CYP, SDR, and UGT gene families).

