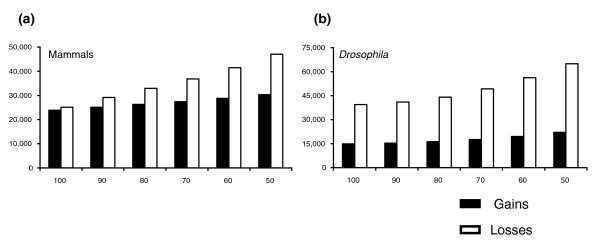
Figure 4.
The effect of tree reconciliation bias. The graphs show the relationship between the number of gains and losses inferred as a function of the bootstrap cut-off used for (a) the mammalian tree, and (b) the Drosophila tree. The numbers represent the sum of gains and losses across all branches of the species trees.

