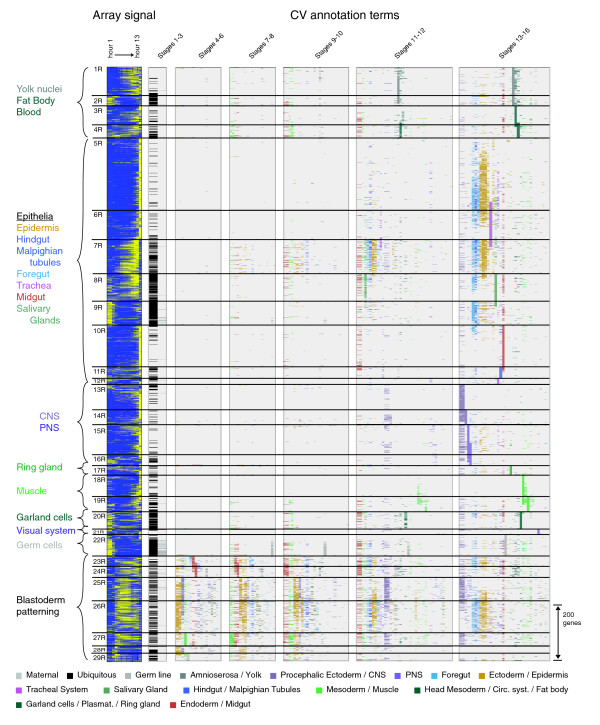
Figure 5.
Clustered gene expression data for genes expressed in a restricted manner. We divided genes with restricted expression patterns into 29 clusters labeled 1R-29R, each cluster separated by a horizontal black bar. We used the same conventions as described for the broad clusters to capture and display the microarray and embryonic expression data (see legend to Figure 4).

