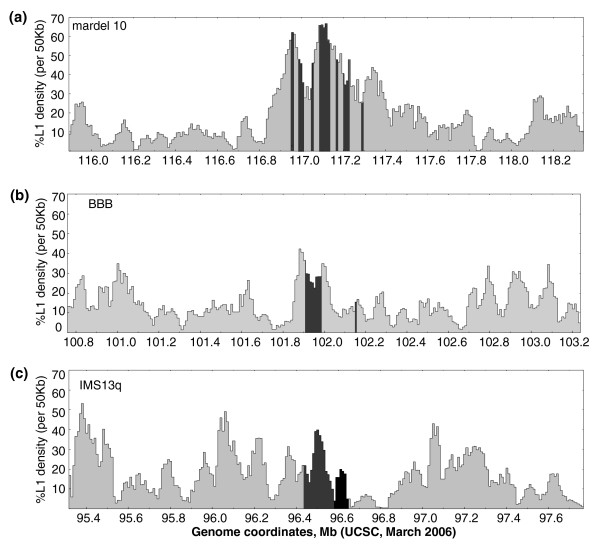
Figure 5.
Sliding window analysis of LINE1 density at neocentromeres. The long interspersed nucleotide element (LINE)1 (L1) density of 50 kilobase (kb) windows shifted every 10 kb are shown across 2.5 megabase (Mb) regions centered on human neocentromeres that have been localized by chromatin immunoprecipitation (ChIP) analysis. The hg18 genome coordinates [50] for each region are shown on the x-axis; the density of L1 elements as percentage of base pairs per each 50 kb window are shown on the y axis. (a) mardel10, the centromere protein (CENP)-A domains indicated by the shaded regions. The CENP-C domain has not been determined. The CENP-H domain has been mapped to hg17 genome coordinates chr10: 115,058,211 to 115,833,955 [50], which are outside this window [39]. (b) BBB. The CENP-A, CENP-C, and CENP-H domains are indicated by the shaded regions. (c) IMS13q. Shaded and black region indicate colocalization of CENP-A, CENP-C, and CENP-H, and shaded area indicates extent of CENP-A domain beyond this region. This neocentromere was mapped using lower resolution bacterial artificial chromosome (BAC) microarrays.

