
Figure 2. Ngb protein expression and SOD, GPX and Catalase activity in PC12 cells following Ngb transfection.
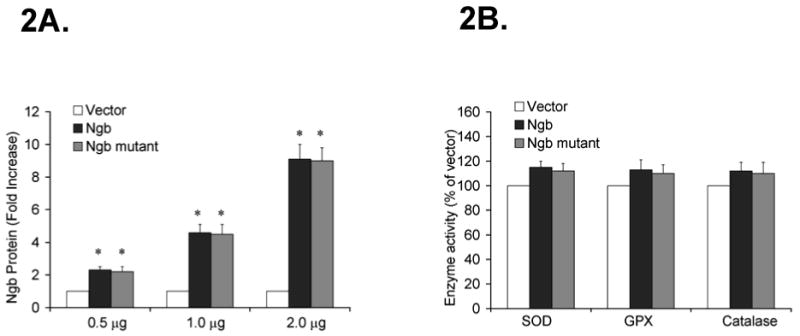
PC12 cells were transfected with 0.5 μg, 1.0 μg and 2.0 μg/106 cells of Ngb, Ngb mutant or vector DNA for 48 h. Following transfection, Ngb protein expression was determined by Western blotting. 2A, Immunoblots of Ngb protein expression following Ngb transfection. Data were expressed as a fold increase over vector transfection (n=6/group, * P<0.01 vs. vector). 2B. Enzymatic activity of SOD, GPX and Catalase following Ngb transfection. Data were expressed as absolute OD values (570 nm OD) (n=6/group, * P<0.01 vs. vector).