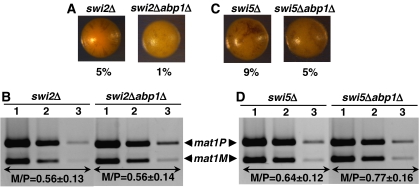
Figure 6.
Analysis of the effects on mating-type switching of deleting abp1 in swi2Δ (A, B) and swi5Δ (C, D) cells. (A, C) Iodine staining of the indicated strains. Numbers below each panel correspond to the frequencies of sporulation. (B, D) Quantitative multiplex PCR determination of the predominant mating type adopted by each of the indicated strains. PCR reactions were performed as in Figure 1D. The M/P ratios (±s.d.) are indicated below the corresponding lanes.

