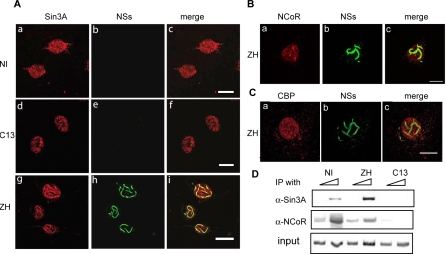
Figure 4. Sin3A and N-CoR, but Not Co-Activator CBP, Interact with IFN-β Promoter in ZH Infected Cells.
Colocalization of endogenous Sin3A (A), N-CoR (B) and CBP proteins (C) with NSs filament was analyzed by confocal microscopy in L929 wt330 cells uninfected (NI) or infected with ZH or C13 at m.o.i. 5 collected at 18 h p.i. Each row represents a single optical section of the same nucleus. (A) Left panels (a, d, g) correspond to Sin3A distribution revealed with rabbit anti-Sin3A polyclonal antibody. Middle panels (b, e, h) show subnuclear NSs distribution detected with mouse anti-NSs polyclonal antibody. Merged images of Sin3A and NSs are shown on right panels (c, f, i). (B and C) Left panel (a) corresponds to NCoR (B) or CBP (C) distribution revealed with goat anti-NCoR polyclonal antibody or rabbit anti-CBP polyclonal antibody. Middle panel (b) shows subnuclear NSs distribution detected with rabbit anti-NSs polyclonal antibody. Merged images are shown in right panels (c). Scale bar, 10 μm. (D) Inputs or DNA immunoprecipitated (IP) with anti-Sin3A and anti-NCoR antibodies collected from murine L929 wt330 cells either uninfected (NI) or 6 h after infection by ZH or C13 was amplified with specific primers.

