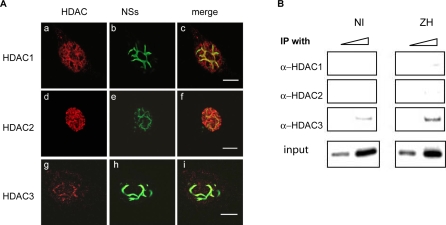
Figure 5. Recruitment of HDAC-3 on the IFN-β Promoter.
Colocalization of endogenous HDACs-1, 2, and 3 with NSs filament was analyzed by immunofluorescence technique and confocal microscopy in L929 wt330 cells uninfected (NI) or infected with ZH or C13 at m.o.i. 5 collected at 18 h p.i. Each row represents a single optical section of the same nucleus. (A) Left panels (a, d, g) correspond to HDAC-1, 2, or 3 subnuclear distribution revealed with mouse anti-HDAC1, 2, or 3 monoclonal antibodies. Middle panels (b, e, h) show subnuclear NSs distribution detected with rabbit polyclonal anti-NSs antibody. Merged images of HDACs-1, 2, or 3 and NSs are shown on right panels (c, f, i). Scale bar, 10 μm. (B) Inputs and DNA immunoprecipitated (IP) with anti-HDACs-1, 2, and 3 antibodies collected from murine L929 wt330 cells either uninfected (NI) or 6 h after infection by ZH was amplified with specific primers.

