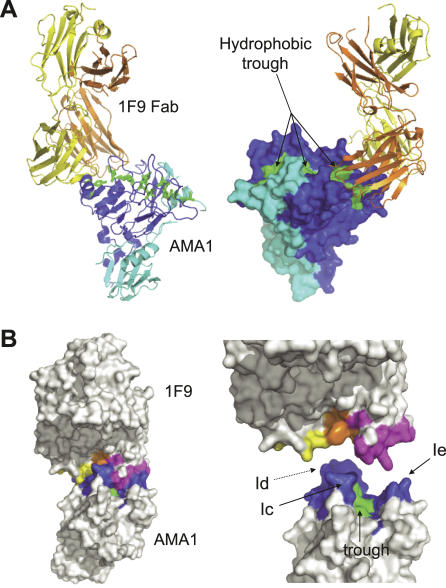
Figure 1. Structure of AMA1 in Complex with 1F9 Fab.
(A) Alternate views of AMA1 in complex with 1F9 Fab. Backbone trace of 1F9 Fab with the heavy chain coloured orange and the light chain coloured yellow. Backbone trace of AMA1 (left) or surface view (right) with domain I coloured dark blue and domain II coloured light blue. The AMA1 hydrophobic trough is coloured green. This figure and other figures depicting the structure were generated using PyMOL [56].
(B) Surface representation of the 1F9 Fab bound to AMA1. View of the complex (left), or 1F9 and AMA1 separated (right). Light chain residues that contact AMA1 (within 4 Å) are coloured yellow. Heavy chain residues that contact AMA1 are coloured orange (residues from the CDR loops) or pink (framework residues). AMA1 residues within 4 Å of 1F9 are coloured dark blue, with the hydrophobic trough residues contacting 1F9 coloured green. AMA1 loops Ic, Id, and Ie are indicated.

