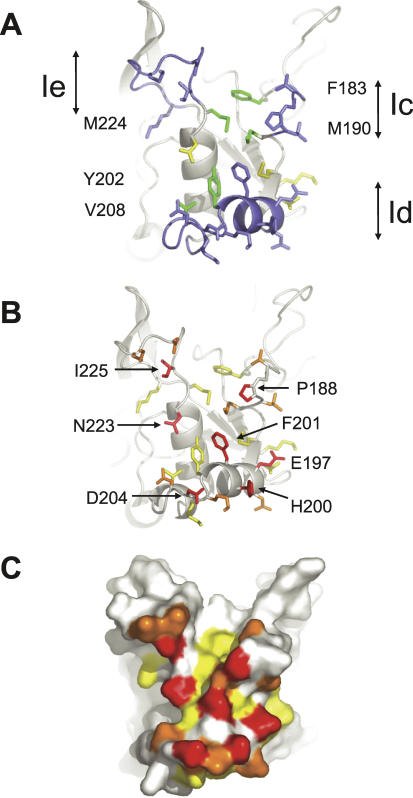
Figure 2. 1F9 Epitope on AMA1.
(A,B) Show identical views of the epitope with side chains that interact with AMA1 with a buried surface area of 7 Å2 or more shown in stick form.
(C) Is the same view but showing the surface of the epitope.
(A) Hydrophobic trough residues that contact 1F9 are shown in green with their residue numbers on either side of the figure. Loops Ic, Id, and Ie and their 1F9-contacting residues are shown in blue. Side chains that extend from the PAN domain scaffold and interact with 1F9 are coloured yellow.
(B,C) Principal contact residues. Side chains contacting 1F9 with a surface area of greater than 78 Å2 or more are coloured red. Side chains with a contact surface area of between 68 and 38 Å2 are coloured orange. Side chains with a contact surface area of between 24 and 7 Å2 are coloured yellow. Surface area interactions were calculated using AREAIMOL [54].

