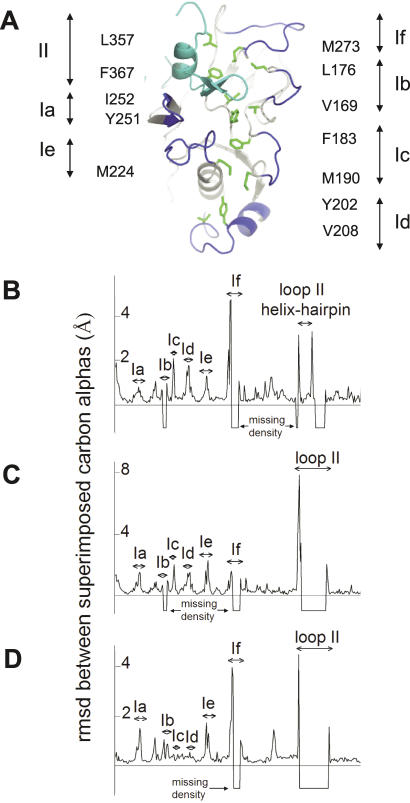
Figure 5. Comparison of Free and 1F9-Complexed AMA1 Structures.
(A) Structure of the hydrophobic trough and surrounding loops. Domain I loops, Ia-If, are shown in dark blue. The domain II loop, II, is shown in light blue. The 12 hydrophobic trough residues are shown in green with the label on either side of the figure showing the amino acid and numbering. I252 and Y251 are not adjacent to loop Ia, but other trough residue labels are shown next to the loop they are associated with.
(B–D) Comparison of the main-chain trajectories of AMA1 structures.rmsds between superimposed carbon alphas were calculated using the program LSQKAB [54] and plotted for each residue.
(A) Comparison between AMA1 model 1Z40 and AMA1-1F9 crystal form 1.
(B) Comparison between AMA1 model 1Z40 and AMA1-1F9 crystal form 2.
(C) Comparison between AMA1-1F9 crystal forms 1 and 2. In instances where residues were missing in either of the compared models the rmsd was assigned a value of −1.

