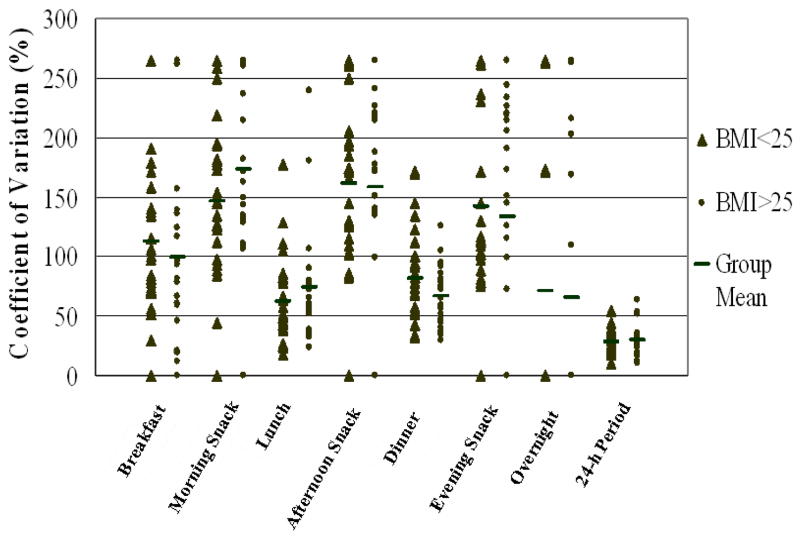
Figure 2.
Coefficients of variation for total daily energy intake (24-h period) and for energy intake at seven eating periods for normal weight (n = 27) and overweight and obese (n = 23) participants. Each point represents the mean value for a single participant for seven days, except where the values for two or more participants coincide and one data point is shown.

