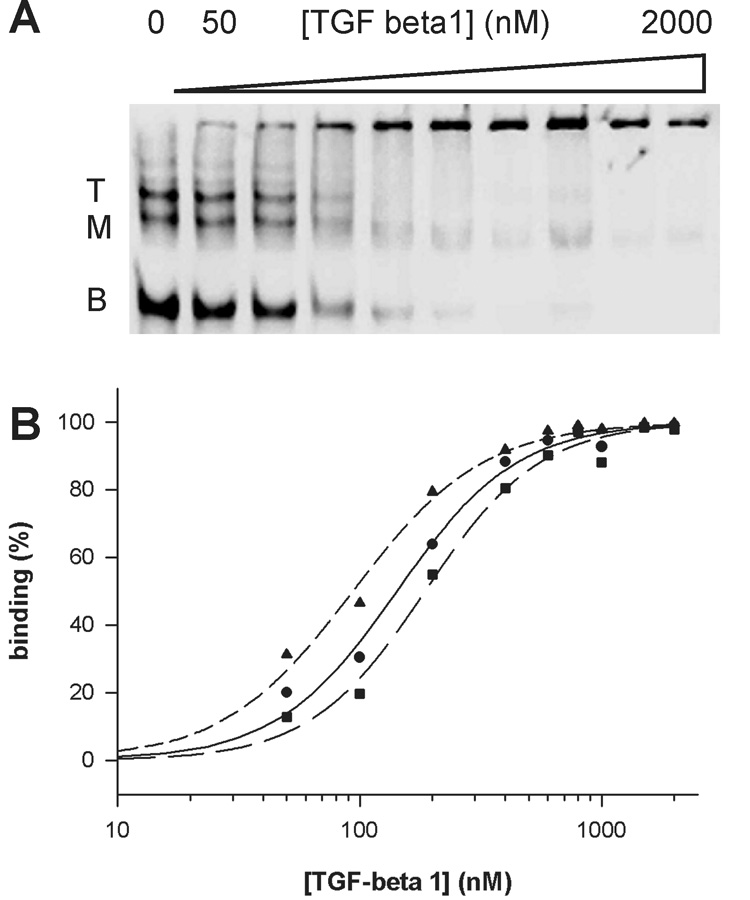
Figure 3.

(A) EMSA of a thioaptamer T18_1_3 (4 nM) with TGF-β1 protein. T, M, and B represent top, middle, and bottom bands of the thioaptamer, respectively. Data fitting to a Hill equation were shown in (B) where the circle and solid line is for the top band, the square and long dashed line is for the middle band, and the triangle and short dashed line is for the bottom band.
