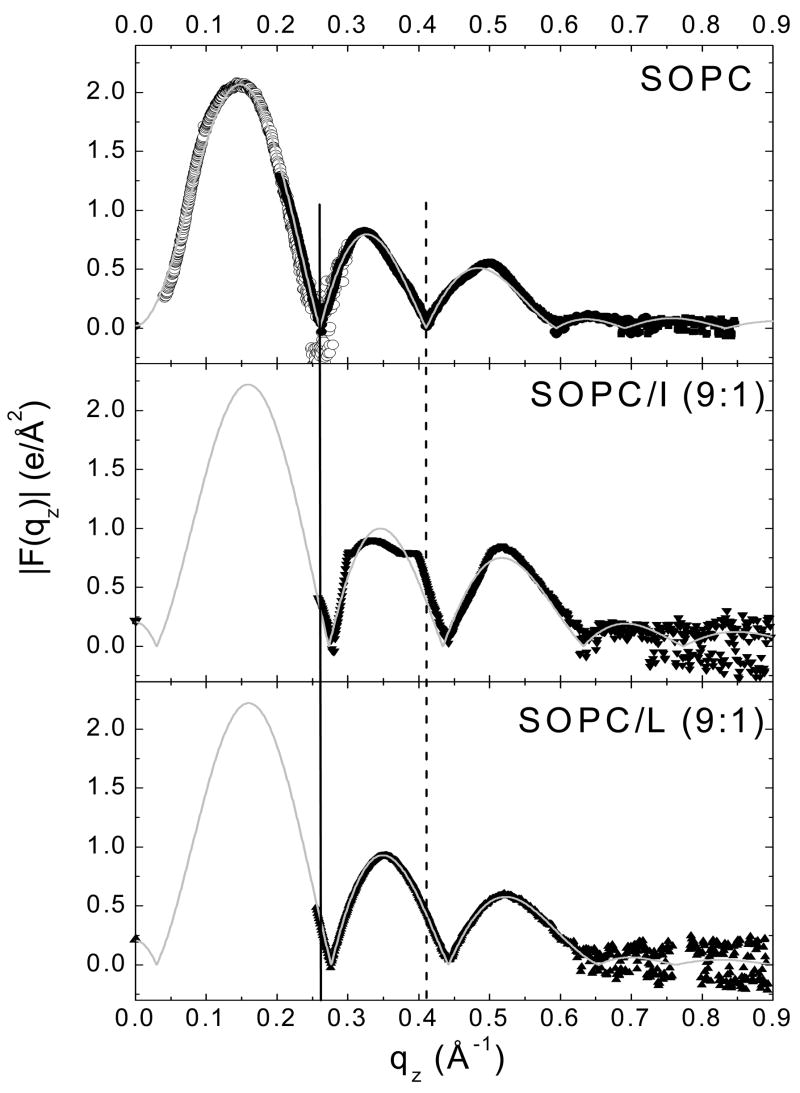
Figure 4.
|F(qz)| data for SOPC, SOPC/I (9:1) and SOPC/L (9:1). Solid symbols represent data from oriented samples. Open symbols for SOPC only were obtained from unilamellar vesicles (ULV). The solid and dotted vertical lines show shifts in the q values for the zeros in |F(qz)| compared to SOPC. The thin solid curves show the fits of the H2 model to the data.

