
Figure 3.
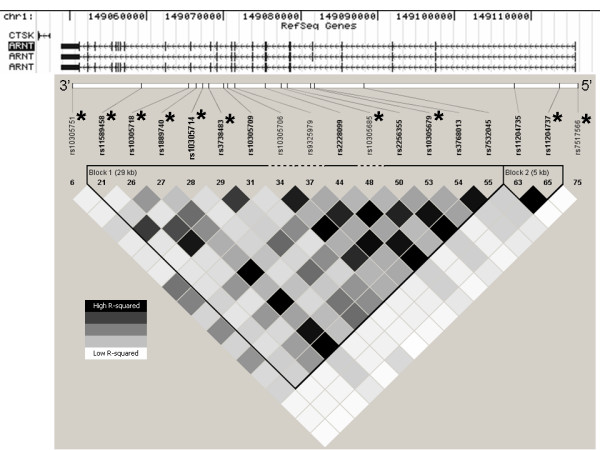
Linkage disequilibrium pattern of the ARNT region based on HapMap data in Yorubans. Figure 3 is identical to Figure 2, except shown in Yorubans for selection of SNPs in African Americans. Asterisks (*) identify markers selected for genotyping.