Figure 6.

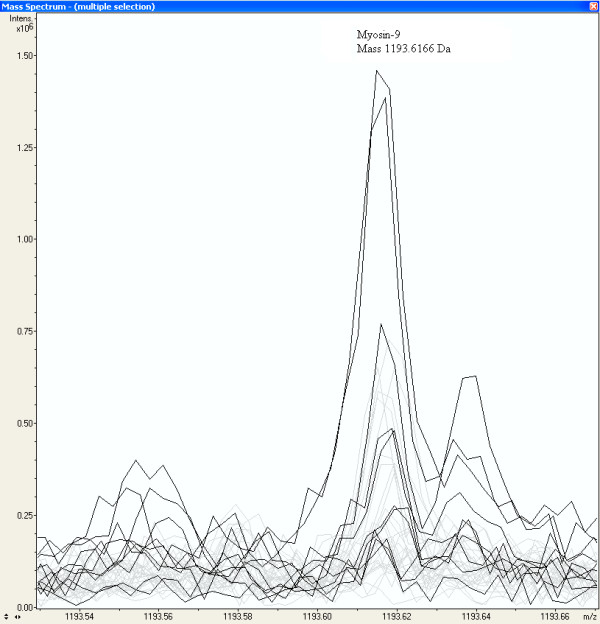
An equal distribution of peak intensities among all samples of a Myosin-9 peptide mass at 1193.6166 Da. The dark lines represent the peak intensities of the glioma vessel samples.

An equal distribution of peak intensities among all samples of a Myosin-9 peptide mass at 1193.6166 Da. The dark lines represent the peak intensities of the glioma vessel samples.