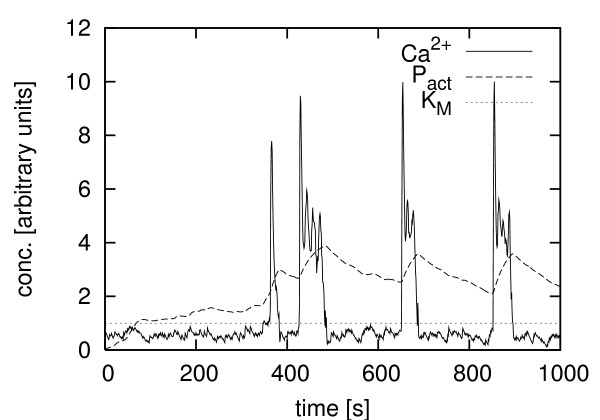
Figure 2.
Experimental data and simulated enzyme activation. Coupling of the stochastically simulated activation of an enzyme to an experimentally measured calcium time series according to Eq. (1). Here the hepatocyte was stimulated using ATP (1.5 μM). x-axis: time [s]. y-axis: concentration of Ca2+ and the active form of the enzyme Pact and the simulated enzyme's KM value (reaction volume of the simulated enzyme 10-10 [arbitrary units]).

