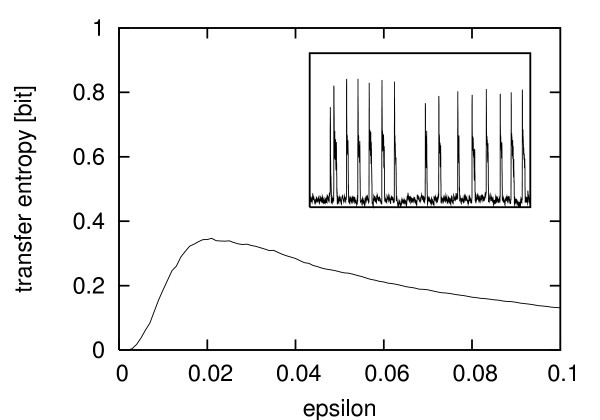
Figure 6.
Transfer entropy of semi-experimental data. Scan of the estimated transfer entropy from an experimentally measured Ca2+ time series (3904 s) to the simulated target enzyme Pact according to Eq. (1). Here the hepatocyte was stimulated using ATP (1.5 μM). x-axis: ε values. y-axis: estimates of the transfer entropy. (reaction volume of the simulated enzyme 10-10 [arbitrary units]).

