Figure 7.
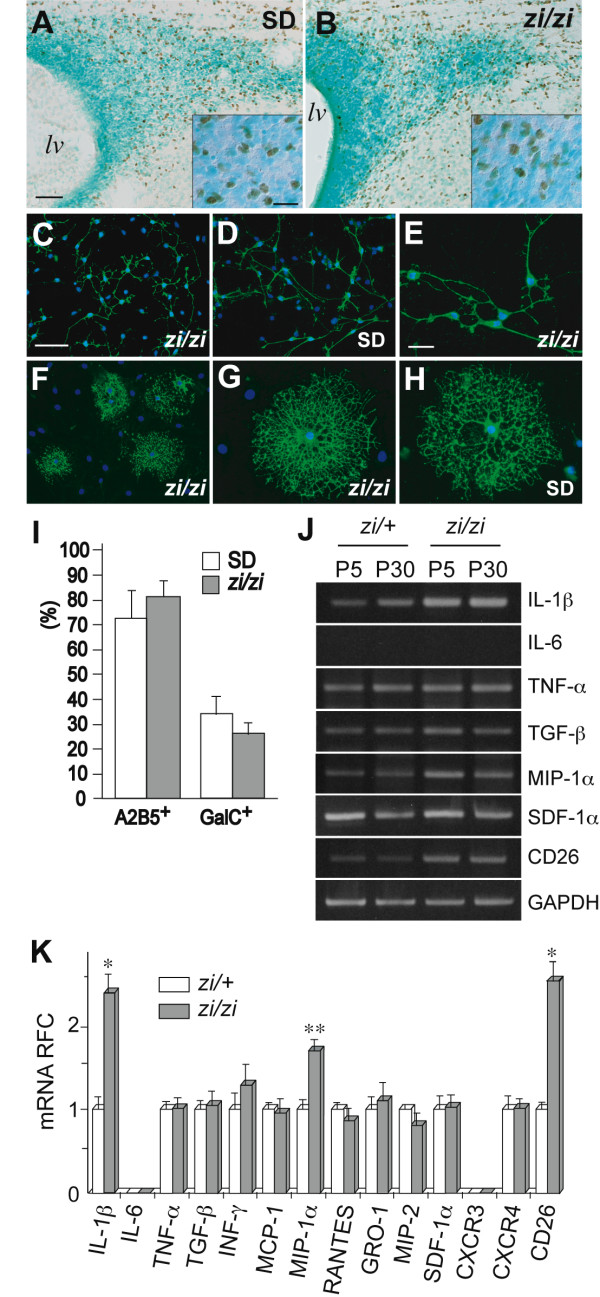
In vitro differentiation assays of oligodendrocytes and semiquantitative analysis of cytokine/chemokine mRNAs. A, B, Distribution of Olig2-positive glial progenitors (brown) in the SVZ surrounding the lateral ventricle in the wild-type (SD) rat (A) or zi/zi rats (B) at P7. Lateral is to the right and dorsal is up. Insets indicate higher magnifications of Olig2-positive cells lying in the SVZ. C-I, Primary culture of OPCs and subsequent in vitro differentiation assays. C, D, OPCs from zi/zi (C) or control wild-type rat brains (D) were immunostained with A2B5 (green). Nuclei were counterstained with Hoechst dye (blue). E, Higher magnification of A2B5-positive OPCs prepared from zi/zi pups, representing a bipolar morphology. F, A differentiated culture of oligodendrocytes from zi/zi rats was immunostained with GalC (green). G, H, Higher magnification of GalC-positive cells induced from zi/zi OPCs (G) or control OPCs (H). I, Quantification of the fractions of A2B5-positive OPCs and GalC-positive differentiated oligodendrocytes. The ratios of the number of cells positive for each marker to the total number of cells were calculated and presented as the mean ± SEM (%). Scale bars: 100 μm (A, B); 20 μm (inset in A); 50 μm (C-E); 20 μm (F-H). J, Semi-quantitative RT-PCR analysis of cytokine, chemokine and CD26 mRNAs. Total RNA samples prepared from whole brains of zi/+ or zi/zi rats, at P5 or P30, were subjected to RT-PCR analysis using the primer pairs indicated at the right side of the panels. RT-PCR for gapdh mRNA was used as an internal control. A typical electrophoresis pattern of the RT-PCR products is shown on an agarose gel. K, The mRNA levels in P5 brains were expressed as relative fold change (RFC) ± SEM. unpaired t-test: **, P < 0.05; *, P < 0.01; compared with control zi/+ rats.

