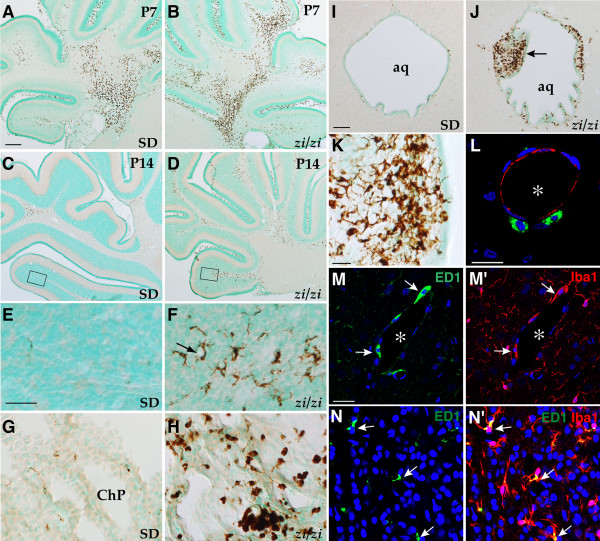
Figure 8.
Accelerated recruitment of macrophages/microglia into the brain parenchyma in zi/zi rats during early postnatal period. A-K, Distribution of ED1-positive cells in wild-type (A, C, E, G, I) and zi/zi (B, D, F, H, J-N) rats. A-D, Coronal sections of the developing cerebellum at P7 (A, B) and P14 (C, D). E, F, Higher magnification of the boxed regions in C and D, respectively, showing the ED1-positive cells in the internal granule cell layer of the paraflocculus. Arrow indicates a capillary. G, H, Choroid plexus in the lateral ventricles at P14. I, J, Coronal sections through the aqueduct of the P14 brain. Arrow indicates the abnormal accumulation of ED1-positive cells underneath the ependymal layer and the formation of polyp-like protrusions into the aqueductal lumen. K, Higher magnification of ED1-positive cells in the abnormal protrusion shown in J. L, Scanning confocal image of a transverse section of a blood vessel in the zi/zi pons at P21, representing the ED1-positive cells (green) and vWF-positive endothelial cells (red), with nuclear staining by TOPRO3 dye (blue). Asterisk indicates the vascular lumen. M, M', Confocal images of immunofluorescence labeling with ED1 (green) and Iba1 (red) across the vasculature in the P21 zi/zi cerebellum. Arrows represent ED1-positive and Iba1-positive elongated cells found in the perivascular region. N, N', Confocal images of immunostaining for ED1 (green) and Iba1 (red) through the section of the internal granular cell layer of the P21 zi/zi cerebellum. Arrows indicate the ED1-positive and Iba1-positive ramified microglia. Panels M/M' and N/N' represent pairs of double-stained photomicrographs. Scale bars: 200 μm (A-D); 50 μm (E-H); 100 μm (I, J); 25 μm (K); 20 μm (L); 20 μm (M, N). ChP, choroid plexus; aq, cerebral aqueduct.

