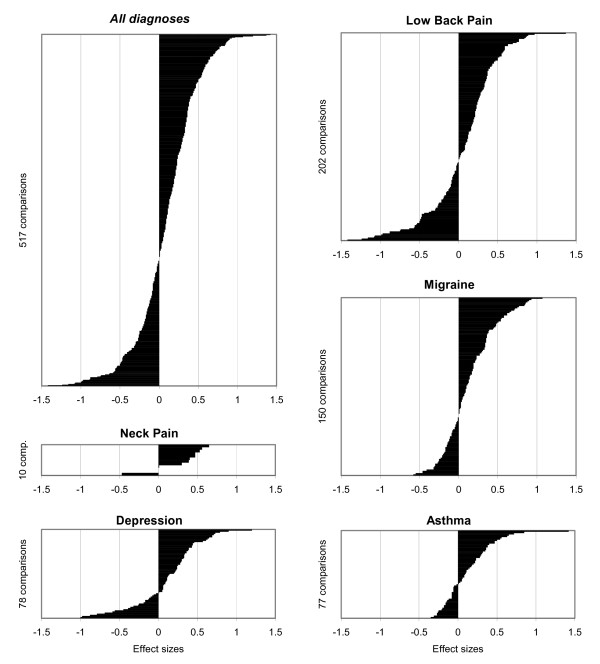
Figure 2.
Outcome comparisons stratified by diagnoses. Differences between pre-post improvements of AMOS cohorts and improvements of corresponding cohorts for all SF-36 scales and summary measures, expressed in effect sizes and ordered in increasing magnitude: for all diagnoses and for individual diagnoses (altogether n = 517 comparisons). Positive effect sizes indicate larger pre-post improvement in AMOS cohort than in corresponding cohort.

