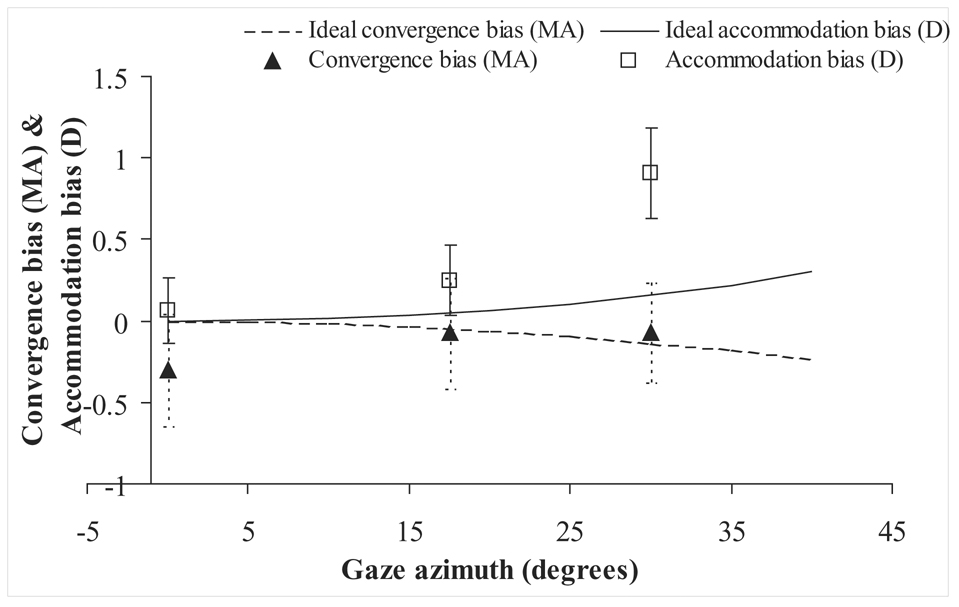
Figure 8.
The average accommodative bias (open squares), relative to a 0D reference, and convergence phoria (filled triangles), relative to zero convergence in primary position, are presented as a function of azimuth. Error bars represent one standard error of the mean. The dashed line and the solid line represent the ideal convergence bias and accommodation bias as a function of azimuth respectively for a 1m viewing distance at zero azimuth.

