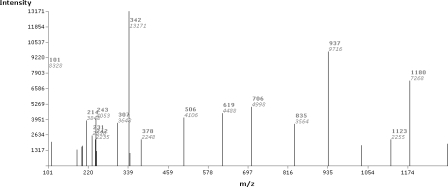
Figure 3. Example of a PFF spectrum from the HUPO Brain Proteome Project.
The bold numbers associated with each peak give the m/z value, while the italic numbers associated with the peak show the intensity value. This “stick” spectrum has been processed from the raw output of the mass spectrometer. Available at http://www.ebi.ac.uk/pride/viewSpectrum.do?mzDataAccession=1717&spectrumReference=32494.

