
Figure 4. 20 Differentially Expressed Genes Selected for High Variance within Their Probesets.
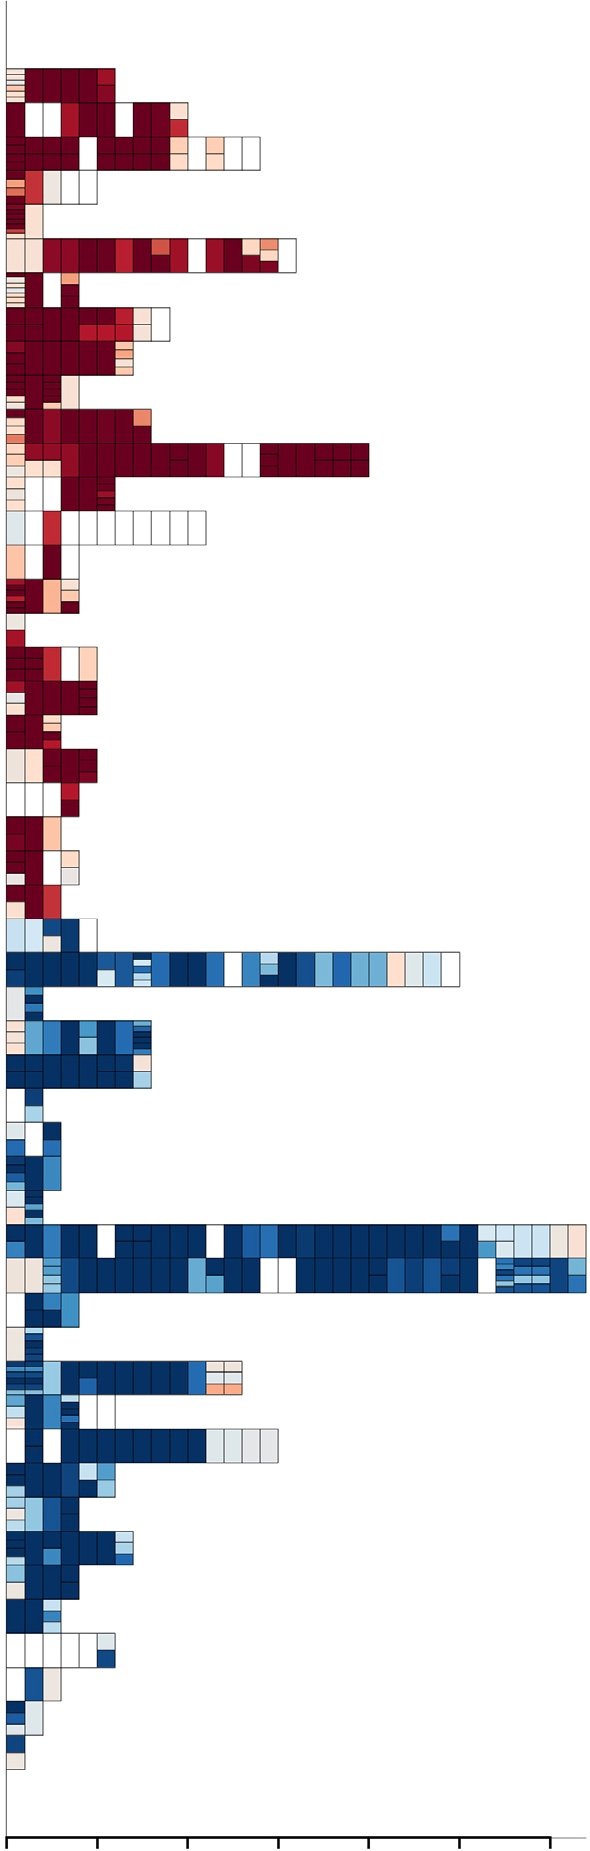
Each row corresponds to a gene, each rectangle to an exon. Exons are arranged in sequence order. If an exon is targeted by multiple probesets, these are stacked vertically within that exon. The plot is coloured by fold change between MCF7 and MCF10A (red, up in MCF7; blue, up in MCF10A).