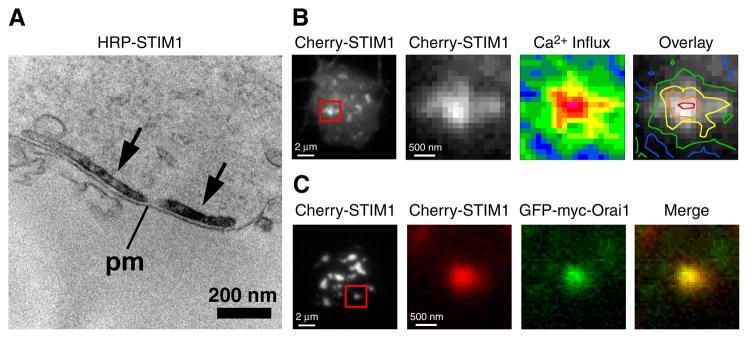
Figure 2.
The elementary unit of store-operated Ca2+ entry. Electron micrograph and TIRF images of individual Jurkat cells treated with TG to deplete stores and exposed to cytochalasin D to disperse puncta. (A) HRP-STIM1 accumulates in ER tubules (arrows) located 10-25 nm from the plasma membrane (pm). (B) TIRF images of Cherry-STIM1 fluorescence at the cell footprint (left) and at a single punctum within the boxed area. Ca2+ influx (middle) at the same punctum is expressed as pseudocolored ΔF/F0 ratios from minimum (blue; −0.01) to maximum (red; 1.05) levels. Pseudocolored contour lines of Ca2+ influx density overlaid on the Cherry-STIM1 image (right) show a close association between the Ca2+ influx site and the STIM1 punctum. (C) TIRF images of Cherry-STIM1 fluorescence at the cell footprint (left) and at a single punctum within the boxed area. Cherry-STIM1 (red) and GFP-myc-Orai1 (green) colocalize (merged image). Reproduced from [59]. Copyright 2006 Rockefeller University Press.

