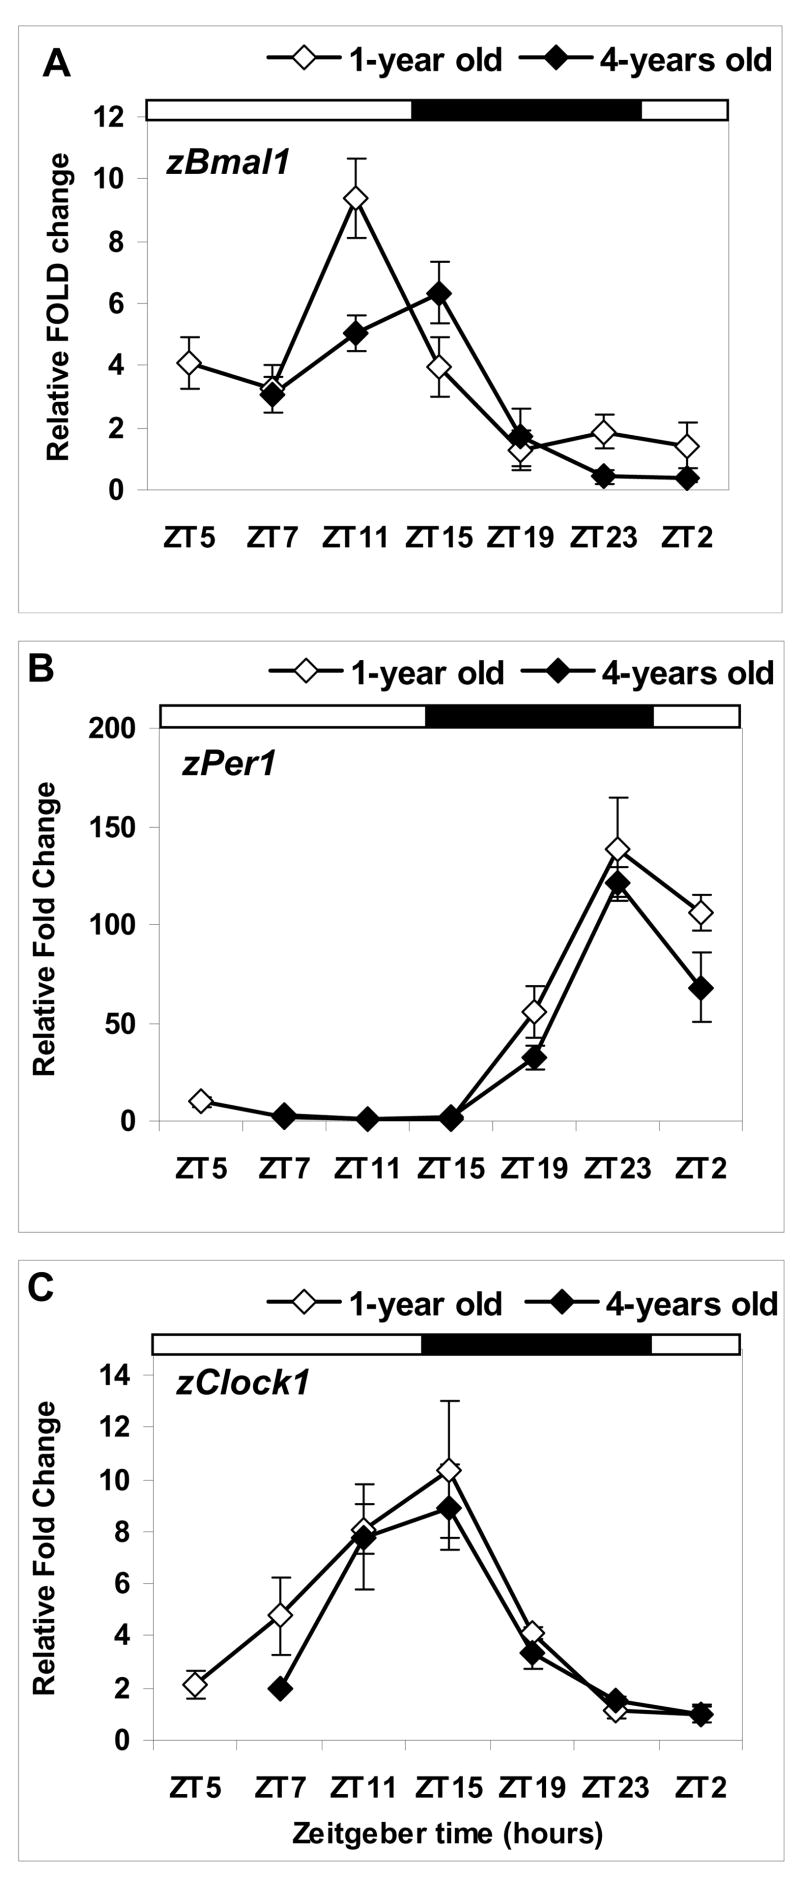
Figure 4. Daily pattern of circadian gene expression is changed in aged compared to young zebrafish maintained in LD.
Relative mRNA levels for zBmal1, zPer1 and zClock1 in the eyes of 1-year old (white) and 4-year old (black) zebrafish are presented as fold change relative to the mean mRNA level of expression in 1-year old zebrafish at the time of the daily trough (see Results), represented in each plot (A–C) as 1 on Y axis. Each data point represents the mean (SEM) of relative mRNA expression in 4–6 individual fish samples, each measured in triplicate. The results of the statistical analysis using Proc Mixed are listed in the text. X-axis: zeitgeber time (ZT 0 = lights on, ZT14-lights off), with light-dark cycle represented by horizontal bars above each plot.

