
Fig. 4. Progressive decrease of class I HDAC expression in the medial corpus callosum of aged mice.
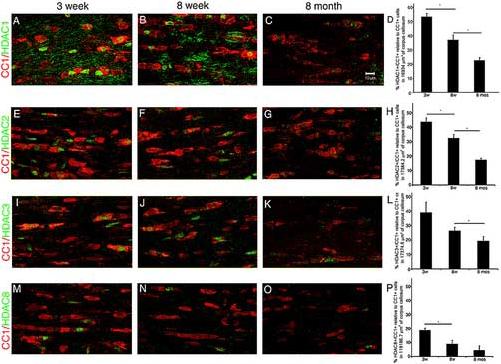
Confocal images of coronal brain sections stained with antibodies against the class I histone deacetylases HDAC1 (A-C), HDAC2 (E-G), HDAC3 (I-K) and HDAC8 (M-O) and against the cell surface oligodendrocytic marker CC1 (red). (Scale bar = 10 μm 63X objective). Bar graphs (panel D, H, L, P) represent the results of the corresponding double HDAC+ CC1+ cell counts normalized by total number of CC1+ cell count (* p<0.01).