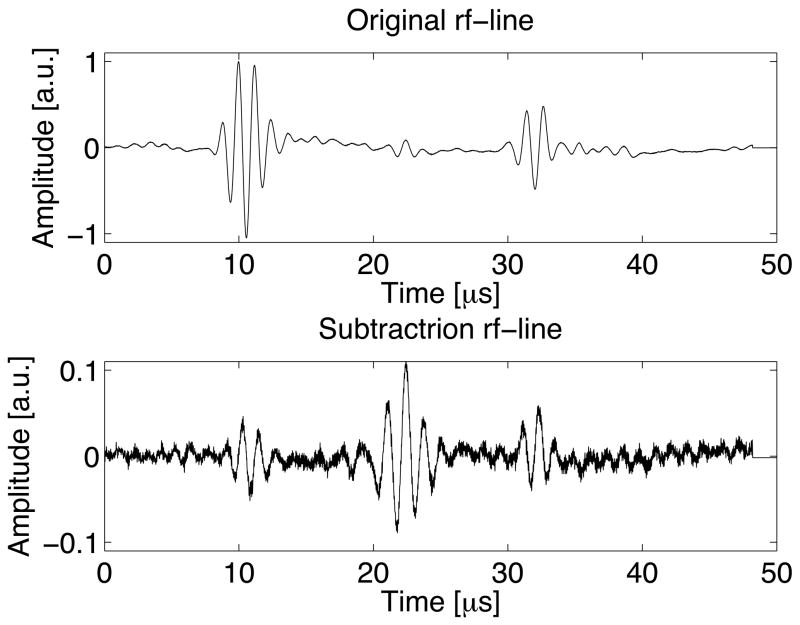
Figure 7.
A waveform using a 118 μm bubble before subtraction (top) and, on the same time scale, after subtraction (bottom). The echo at 22 μs is from the bubble, while the echoes at 10 μs and 32 μs are from the dialysis tube walls. Both plots use the same arbitrary units, so the magnitudes of the waveforms can be directly compared.

