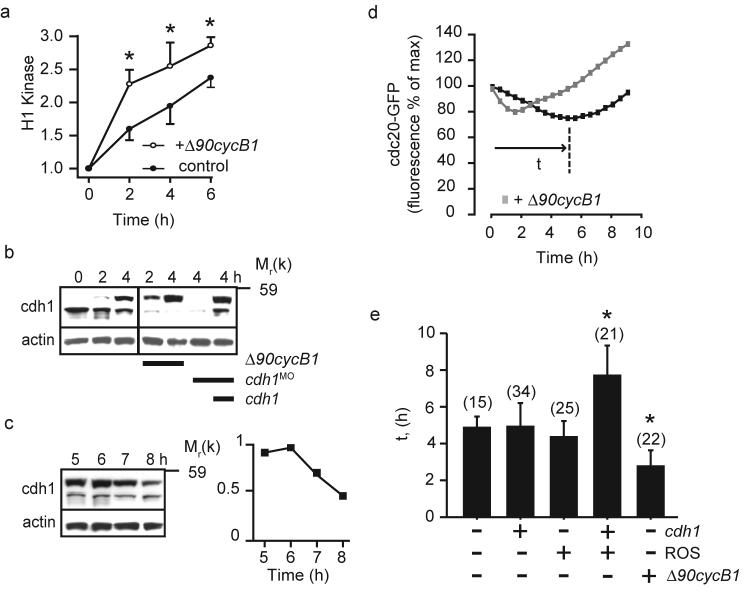
Figure 5.
CDK1 regulation of prometaphase APCcdh1. a, H1 kinase assays of maturing oocytes at the times indicated, normalised with respect to time 0 h (GV arrest). Some GV oocytes were microinjected with Δ90cyclin B1 cRNA (Δ90cycB1) before maturation (n=5). Δ90cyclin B1 increased the rate of rise of H1 kinase activity following GVB. (b and c) cdh1 expression in oocytes at the times indicated after GVB. In (b), cdh1MO, or cRNA for Δ90cyclin B1 and cdh1 were microinjected as indicated. d, cdc20-GFP fluorescence changes in a control (black) and Δ90cyclin B1 cRNA injected oocytes (grey), plotted with respect to time as a percentage of the maximum recorded fluorescence before any cdc20 loss. Time t is the time taken to reach the minimum recorded fluorescence from the start of cdc20 degradation and is plotted in (e). e, The period of cdc20-GFP degradation (t), calculated from experiments performed as in part (d), in oocytes injected with cRNA for Δ90cyclin B1 and cdh1 or treated with roscovitine (ROS). Numbers examined in parentheses with oocytes pooled for each condition from at least 2 independent experiments. In (a) and (e) error bars are s.d. and asterisks mark timepoints that are significantly different from: time 0 (a) or no additions (e) (p<0.05, ANOVA).

