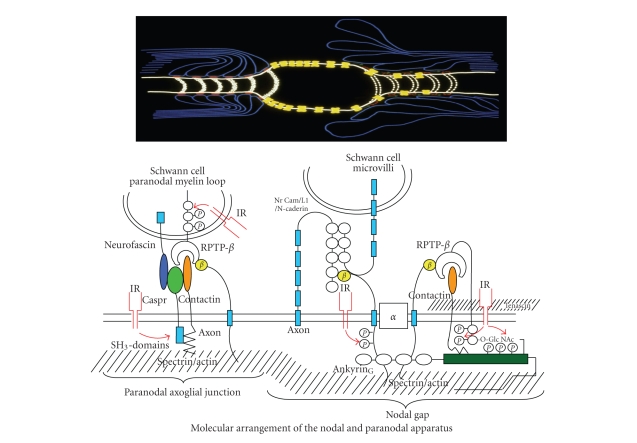
Figure 5.
Schematic illustration of the nodal and paranodal molecular architecture in the normal situation (top left) and in the type 1 DPN (top right). The intricate relationships between several paranodal adhesive molecules emanating from the terminal myelin loops and the paranodal axolemma are depicted. Note the colocalization of the insulin receptor (IR) (bottom left). At the node the gated Na-α-channels are “anchored” to the axolemma via interaction with β-Na+-channels, RPTPβ, contactin, and their interaction with ankyrinG, (bottom right). For further explanation of the molecular perturbations in type 1 diabetes and the effect of C-peptide, see text [18].

