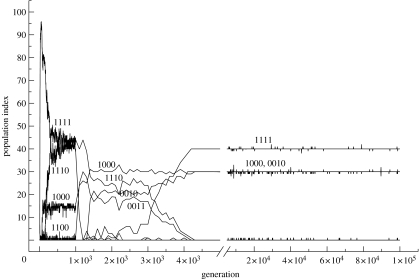
Figure 2.
The values of the population indices of the phenotypes (as labelled on the graph) in the population are plotted for one of the simulations of the population evolving in the environment four plant types of the values as resources: 40, 10, 40 and 10. The population index reflects the number of phenotypes and their purity. Phenotype labels denote an array of preference to the four plants, in which 1 is preference and 0 is rejection. Owing to the response function chosen for the insect phenotypes, they will tend to be all-or-none responses to each plant (see text for details). Values obtained every generation until 1000 generations, and thereafter every 100 generation are plotted. The scale of the abscissa is varied to portray both short- and long-term trajectories (Holmgren & Getz 2000).

