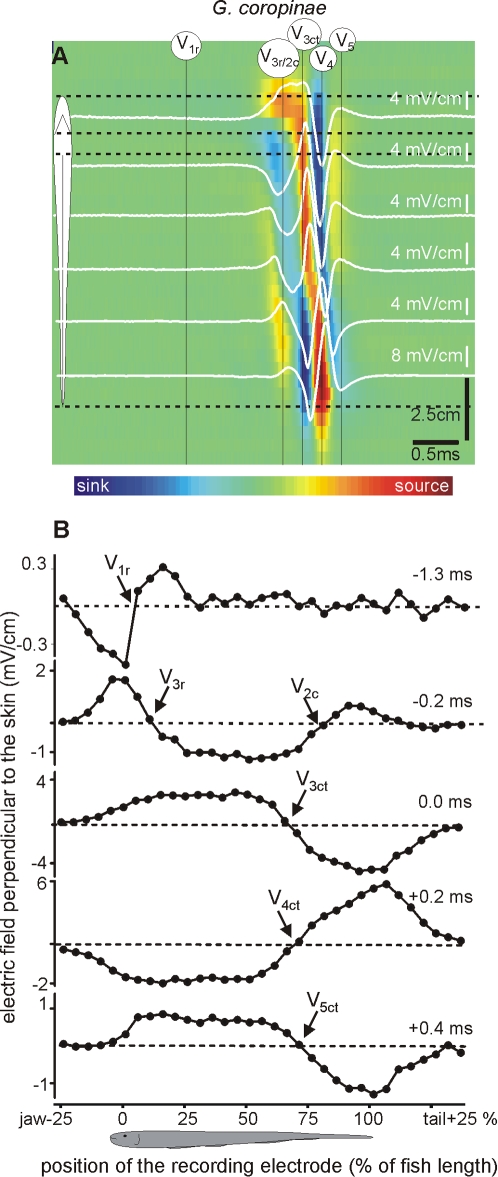
Figure 4. Transcutaneous current pattern of G. coropinae.
Electric fields perpendicular to the main axis of the fish body was recorded along a line 2 mm parallel to the fish side in G. coropinae (same resolution and color code as in Figure 2). We refer to each generator referring to its temporal order (numeral sub index) and spatial origin (literal sub index, r for rostral, c for central, and t for tail). Times are referred to the positive peak (0 ms). This species is characterized by a first observed activity caused by a much localized sink at the head region (note that the reversal point, rostral sink-caudal source, 1.3 ms before the head to tail peak is located almost about the rostral pole of the fish). After a relative long period of time (−0.2 ms) this wave is followed by two spots activity indicated by the presence of two sources (at the head and at the tail) draining the current that sinks along the central body region. Shortly after the above, the fish's body becomes active. The complex V34ct (0 to 0.2 ms) has the same profile as in the other species. Finally the electric organ discharge ends with a small rebound wave (0.4 ms, V5).

