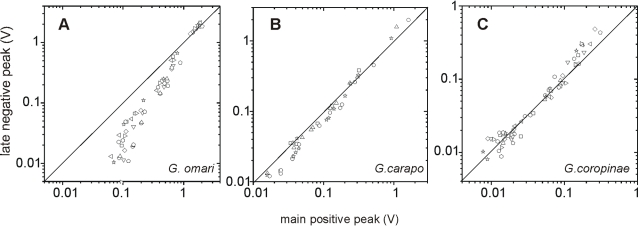
Figure 7. The correlations between the two main peaks indicate different responsiveness of the electrocytes.
The late negative peaks (V4) recorded in air gap conditions from 6 regions of the body were plotted as a function of the main positive peaks (V3) recorded from the same 6 regions. It is shown that the relationship between these components is similar in different fish. Different symbols indicate different specimens (G omari N = 10; G. carapo N = 4; G coropinae N = 10). In G. omari V3 is generally larger than V4 while in G carapo and G. coropinae they are similar. Since the putative mechanism of V4 is the propagation of the action potential causing V3 to the opposite electrocyte face, changes in the slope indicate that the responsiveness of the electrocytes is different for each species-the lowest for G. omari, and the largest for G. coropinae.

