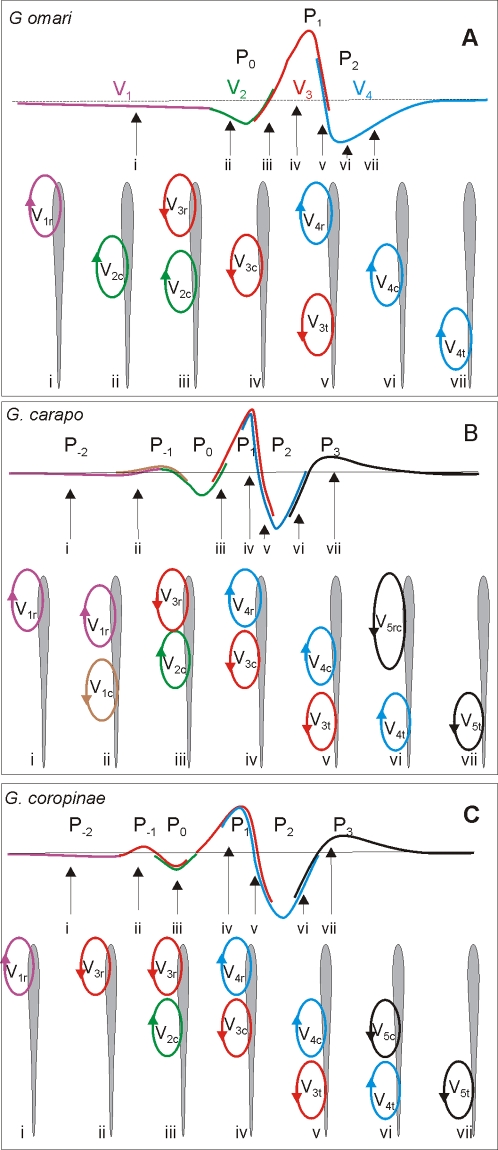
Figure 8. Present hypothesis on the formation of the head to tail electric organ discharge.
In each box the head to tail waveform is represented in the top schematized trace where the participation of regional components in the head to tail is color coded. For the sake of generality we name each component combining a numeral sub index indicating the temporal order and a literal sub index indicating the spatial origin (r for rostral, c for central, and t for tail) . The schemata below represent using a color code the current generators at different regions of the fish body, at seven different times. G. omari is the simplest case: i) the earlier phase of P0 (V1 in the nomenclature of Trujillo-Cenóz et al [44]) corresponds to currents generated by V1r (violet), ii) the late phase of P0 (V2 [44]) corresponds to the summated currents generated by V2c (green) and the beginning of V3r (red) since those have opposite direction their effects are contrary; the beginning of P1 (V3 [44]) is generated by the end of V2c plusV3r, while the peak corresponds to V3c plus V3t. The decay of P1 corresponds to V3t plus the beginning of V4r (red and blue traces superimposed) and P2 (V4) corresponds to V4c plus V4t (blue trace). In G. carapo: the correspondence is: i) P−2 to V1r (violet) ; ii) P−1 to V1r (violet) and V1c (brown); iii) P0 to V2c (green) and V3r (red ) at the end of this wave; iv) the beginning and peak of P1 to V3c (red ) and V4r (blue); v) the decay of P1 to V3t (red ), and V4c (blue) ; vi) P2 to V4t (blue) and V5rc (black); and vii) P3 to V5t (black). In G. coropinae the correspondence is: i) P−2 to V1r (violet); ii) P−1 to V3r (red); iii) P0 to V2c (green) and V3r (red ); iv) the growing phase and the peak of P1 to V3c (red ) andV4r (blue) ; v) the decay of P1 to V4c (blue) and V3t (red ); vi) P2 to V5c (black)and V4t (blue); vii) P3 to V5t (black).

