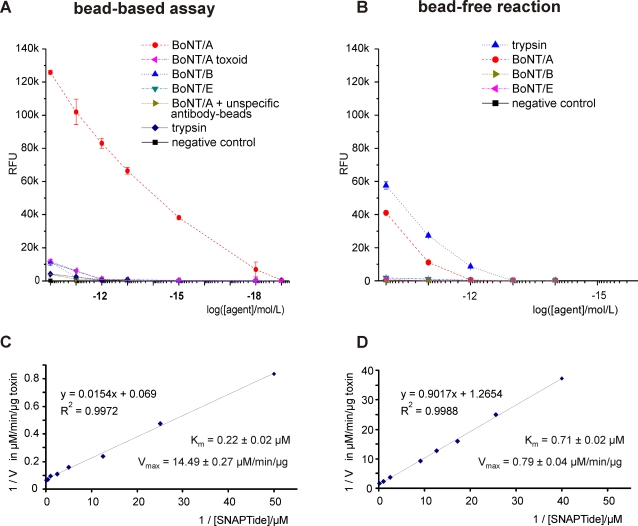
Figure 4. BoNT/A ALISSA versus bead-free SNAPtide cleavage.
Comparison between (A, C) the bead-based assay and (B, D) the bead-free reaction in 10% FBS. (C, D) Lineweaver-Burk (double reciprocal) plots of the BoNT/A reaction rate as a function of the substrate (SNAPtide) concentration. Note different y-axis scales. The solid lines represent linear regression fits.

