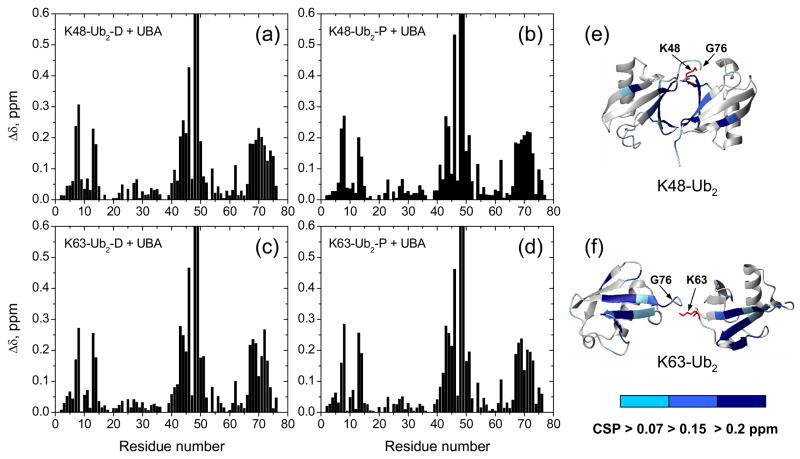
Figure 7.
Chemical shift perturbation mapping of Ub2’s surface involved in UQ1-UBA binding. Shown are CSPs as a function of residue number in (a) distal and (b) proximal domains in K48-Ub2, (c) distal and (d) proximal domains in K63-Ub2, and (e, f) ribbon representations of the corresponding Ub2s colored by the strength of the CSPs. Note that the Δδ values for K48 (>1 ppm) and Q49 (~0.7 ppm) exceed the vertical scale used here. The location of G76 (distal Ub) and the side chain (shown in red stick) of K48 or K63 (proximal Ub) that form the isopeptide bond linking the two Ubs in Ub2 is indicated in (e) and (f).

