Figure 3.

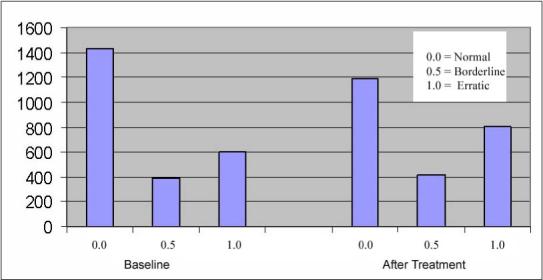
Bar graph comparing the total number of normal (0), borderline (0.5) and erratic (1) hours on the baseline recordings and on the post-antiarrhythmic treatment recordings in the entire study cohort.

Bar graph comparing the total number of normal (0), borderline (0.5) and erratic (1) hours on the baseline recordings and on the post-antiarrhythmic treatment recordings in the entire study cohort.